INVESTMENT
- Assets under management (AUM) in gold-backed ETFs increased in Q1 as political uncertainty fuelled European ETF inflows. European bar and coin demand was strong too
- China’s quarterly bar and coin demand breached 100t for only the fourth time on record – currency weakness, concerns over the property market, and a seasonal boost from Chinese New Year underpinned the market
- India’s bar and coin demand inched up, but remains at historically low levels. The industry, however, is confident the market will recover as the aftershock of demonetisation wanes
ETFs
Global holdings of gold-backed ETFs grew by 109.1t in Q1; total AUM in these products was 2,251.8t by quarter-end, worth just over US$90bn. This increase in holdings is dwarfed by last year’s huge growth: inflows were just one-third of the 342.1t seen in Q1 2016. But this is more an indication of the atypical strength of 2016 inflows than of recent weakness. Indeed, inflows of 109.1t are in line with quarterly average between Q1 2009 and Q4 2011 (108.7t), a period that encompassed the global financial crisis.
Continuing the trend from the second half of 2016, European investors accounted for the bulk of investment in the sector in Q1: inflows into European-listed products were 92.4t, compared with just 14.1t added to holdings of US-listed products. Outflows were minimal during the quarter, indicating a generally positive underlying attitude towards gold-backed ETFs.
Geopolitical tensions became more of a concern for European-based investors than for their US counterparts. Investors focused on the continued rise of anti-establishment parties associated with the growing populist movement across Europe, as well as the potential outcome of elections in the Netherlands and France – particularly in the aftermath of the Brexit vote.
Concerns around the French Presidential election mushroomed with the late surge of far-left, anti-EU politician, Jean-Luc Mélenchon, at the end of the quarter. While the Macron/Le Pen run-off after the first-round had been predicted by the polls, Mélenchon’s gains – as well as the exceptionally high proportion of voters who were undecided – added to the political uncertainty.
On top of a fragile political environment, conditions in financial markets gave investors a further incentive to build their positions in gold-backed ETFs. Safe-haven flows pushed two-year German yields further into negative territory, reaching a record low of -0.95% in February. And European equity markets were subdued with volatility at multi-year lows. Negative real and nominal yields coupled with a period of relative calm in regional stock markets improved the appeal of gold, particularly as its price strengthened through the quarter. The dips in the euro-denominated price of gold in January and March were also taken as a good opportunity to add it to portfolios.
In the US, net inflows of around 45t in February were sandwiched between outflows in January and March. Broadly, though, US investors maintained their underlying positivity towards gold. The bulk of holdings in US-listed products are in strategic hands after much of the looser, more speculative buying that was a feature of the sharp inflows in 2016 was reversed in the November/December washout.
The gold market reacted positively to the Federal Reserve’s dovish guidance when it raised interest rates in March. Having edged lower in advance of the announcement, the gold price rebounded as expectations around future increases in US interest rates eased a little.
The positive view of gold in the US is also well supported by the risks associated with the global geopolitical and economic backdrop (the ongoing crisis in Syria; uncertainty over Brexit; slowing growth in China; friction between the West and Russia; and more recently, tensions over North Korea’s nuclear program). And question-marks remain over the path of US growth and inflation.
Outside of the US and Europe, net flows were minimal. China’s Huaan Yifu Gold ETF continued to outperform: holdings grew by a net 0.8t over the quarter, to 24.9t. But this was exceeded by outflows from other domestic ETFs, leading to net outflows from Chinese gold-backed ETFs of -0.8t.
Bars and coins
Bar and coin demand posted gains, up 9% on the same period last year, reaching 289.8t – equivalent to over US$11bn. The strength of the retail investment market in the first quarter built on 2016’s exceptionally strong finish.
Bar and coin demand was up 9% year-on-year
Demand in China soared in Q1, maintaining the strong momentum established in Q4 2016. At 105.9t it was up 30% y-o-y and was the fourth strongest quarter on record.
Several factors fuelled this boom. Concerns over the weakness of the yuan and the outlook for the real estate market from the tail-end of last year spilled over into 2017; this combined with the usual seasonal strength around Chinese New Year and a rising gold price to support investor sentiment.
Innovation within the market is making gold even more accessible for retail investors. Commercial banks are increasingly looking to develop their gold businesses to offer a compelling proposition to investors. Bank of China, for example, launched an interest-bearing gold product at the end of 2016. It is benchmarked on the Shanghai Gold Exchange (SGE)’s AU9999 contract with a minimum entry point of one gram and is traded online. It also gives investors the option of withdrawing physical gold through the bank’s extensive branch network.
And the product pipeline doesn’t stop there. In the first quarter of this year, Industrial and Commercial Bank of China (ICBC) teamed up with Tencent to launch a new physical gold-backed product – Microgold – targeted at China’s internet users. Through WeChat – with over 800 million users China’s largest social networking app – Microgold users can invest in gold (based on ICBC’s gold accumulation plans), digitally send gold to friends and family in culturally significant red envelopes, and view real-time prices. This innovation will make gold easier to access for China’s digitally savvy millennials.
Sales outside of the banking sector also did well. The SGE continued to gain market share, as high net-worth individuals increasingly used it to buy 1kg bars at low margins. Elsewhere, retailers performed well in the run up to Chinese New Year and in some instances demand exceeded supply; one retailer asked customers to wait until after the lunar New Year to take delivery of their investments.
China appears to be suffering a demand/supply imbalance. Having closely tracked the global spot price since 2014 (premiums have averaged around US$4 over the global spot price in recent years) the local premium shot up in Q4 2016 to an average of US$17/oz. Demand has been healthy, but this was also in part because cross-border capital controls affected gold imports. The premium persisted in Q1, averaging US$14.2/oz, as the after-effects of capital controls rippled through the market and banks adapted to the increased regulatory oversight on imports.
India’s bar and coin demand stood at 31.2t in Q1 – up 3.8t on last year’s low level, but just half its five-year quarterly average. This belies the modest improvement in the market following the sharp liquidity squeeze caused by demonetisation in November. Economic activity almost ground to a halt at the end of 2016 as cash was pulled from the economy – currency in circulation fell 50% from 11th November to 6th January. Sales of motorcycles – a good barometer of the health of the cash-reliant economy – halved in December.
But 2017 has seen an improvement. While the stock of cash is significantly off its peak of November 2016, it increased 43% in Q1 2017. As outlined in the Jewellery section of our report, the increased cash in circulation has helped the economy pick up a little, which in turn has supported the gold market. Gold imports have improved over recent months: Q1 official imports were 106% up on Q1 last year.
Vietnamese investment demand increased 6% y-o-y. Demand was supported by Chinese New Year and the traditional God of Wealth festivities, celebrated on the 10th day of the Lunar New Year. According to Vietnamese tradition, purchasing gold on God of Wealth day will bring a year of prosperity. Several traders reported strong sales. This demand was also supported by the recent depreciation of the Vietnamese dong.
The European bar and coin market is in good health. Our estimate for Q4 2016 was revised up, and the first quarter of 2017, at 60.8t, is up 9% y-o-y. At its core is a strong German market, up 13% y-o-y to 34.3t – the strongest first quarter since 2011. Switzerland and Austria saw decent growth, as did the UK, which hit its highest level since Q2 2013. As with European-based institutional investors, the spectre of political uncertainty prompted retail investors to buy gold as a hedge against the flurry of elections in the Netherlands, France and Germany.
The US market suffered in the first quarter. Demand fell 20% to 16.2t, the lowest level of demand since Q2 2015, as retail investors shifted their focus away from gold to buy into the Trump-rally and chase equity markets higher. Dealers reported that many retail investors took advantage of the rise in the gold price to sell into the secondary market – at times these sales of bars and coins even matched consumer demand. Given this strength of supply it was not surprising to see imported bullion coins fall 22% and US Mint combined Eagle and Buffalo sales fall by around 30% y-o-y.
Central banks and other institutions
Demand for gold as a reserve asset slowed in the first quarter; sales were trivial.
- Central banks continued to buy gold but at a much slower pace: quarterly net purchases reached a six-year low of 76.3t
- Argentina and Hungary both engaged in swap transactions over recent months
Central banks had a slow start to 2017; net purchases dropped to 76.3t in Q1. This is a 27% decline from the 104.1t seen in Q1 2016 and almost a third lower than the 108.5t in Q4 of that year. Looking towards the longer-term trend, demand for gold among central banks has broadly slowed since reaching a peak of 174.9t in mid-2014. This lower rate of purchases is likely to continue throughout 2017.
There were few active buyers in Q1. Russia returned to the market after a brief hiatus in December: gold reserves increased by 64.9t to 1,680.1t, taking gold as a percentage of the country’s reserves to 17%, its highest level since Q1 2000. The National Bank of Kazakhstan added 9.6t to gold reserves in Q1, extending its unbroken run of net purchases to 54 consecutive months.
By contrast, China – one of the largest purchasers in recent years – has left gold reserves untouched since October 2016. This development may be related to shifts in foreign exchange reserves. Although these rose in February for the first time in 7 months, Chinese FX reserves have been under pressure for some time, having dropped from US$3.2 trillion in January 2016 to US$3 trillion in January 2017. As a percentage of total reserves, however, China’s gold remains comfortably above 2%, reaching as much as 2.4% as the gold price rose during Q1, (download our statistics on current and historical global gold reserve holdings). This is its highest share since the early 2000s, and may partly explain the lack of gold purchases in recent months.
Net sales remain at trivial levels. Jordan and Qatar both sold over 3t each in Q1. Czech Republic, Mexico, Mongolia and Mozambique also reduced their gold holdings by modest amounts. Additionally, some central banks entered swap agreements in recent months: Argentina conducted swaps of gold totalling 6.9t as part of a strategy to enhance the yield on their gold holdings; and Hungary lent 3.1t in a swap transaction in December.
Media reports suggest Turkey’s central bank’s gold policy may be evolving. In April, Reuters reported that the Turkish central bank is to be given first option to buy locally mined gold. The central bank will be able to buy gold using lira, thus preserving its FX reserves.
Technology
Gold used by the technology sector grew 3% y-o-y, led by electronics, where gains in the wireless sector were partly offset by shrinkage in demand for LEDs.
- Electronics demand rose by 4% on a yearly basis, but the usual seasonal Q4 –Q1 dip in demand was again observed with a 8% fall
- Bonding wire was resilient, thanks to strong demand for memory chips, but continued progress in reducing wire diameters suggests the sector will decline throughout 2017
- The growth of wireless charging in the smartphone sector should lead to increased demand for gold via the incorporation of additional sensors
Electronics
Gold used in electronics grew 4% y-o-y to 62.1t in Q1. Growth came from the increasing wireless capabilities of smartphones, as well as robust demand for gold bonding wire. After a period of heightened activity in the second half of 2016, demand for gold bonding wire remained resilient in the first quarter of 2017. Strong demand for memory chips helped to offset the negative impact of 3D packaging1, which uses much lower volumes of bonding wire. Continued progress in reducing the diameter of bonding wire and advances in 3D packaging are, however, likely to dominate the sector over the coming quarters.
Developments in the wireless sector were positive for gold usage, many of which were related to smartphone technology. Increasingly, smartphones are expected to offer wireless charging capability. This bodes well for demand for Printed Circuit Boards (PCBs), a component of wireless chargers. Additionally, a more high-end application of gold in smartphones involves the inclusion of vertical-cavity service-emitting lasers (VCSEL)2, which are used in gesture recognition, 3D sensors and 3D video applications. The iPhone 8 – expected to launch later this year – is rumoured to include this technology. These positive trends should offset the effect of the downturn in demand for smartphones.
The LED sector underperformed in Q1, hit by thrifting as miniaturisation continued to take hold. Growth in demand for infrared LED automobile lighting was not enough to offset the effect of the switch to Chip Scale Packaging (CSP)3 in the sector.
Several key Asian markets saw a y-o-y recovery in electronics demand: China grew around 7%, albeit from a low base, while Taiwan was steady, marginally firmer by around 1%. South Korea benefitted from the growth in PCB and memory production, turning in growth of around 3%.
Scientists worldwide continue to uncover new applications for gold that will lead to future sources of demand for the metal. US and UK researchers published a seminal paper in the leading journal Science describing insight into the working of an important gold catalyst currently in production in China.4 The research identified how gold particles within the catalyst drive the formation of an industrially important feedstock chemical. This insight promises to lead to the development of improved gold catalysts for the chemical industry.
Separately, researchers at Missouri University of Science and Technology have developed a new way of using gold to transform “flexible” or wearable technology. By growing thin layers of gold on a single crystal wafer of silicon, they discovered that they could preserve all the positive characteristics of silicon while adding the benefit of gold’s greater durability and flexibility.
Footnotes:
- 3D packaging increases the memory capacity of a flash chip in a smaller space, offering lower cost per gigabyte and greater durability.
- A vertical-cavity surface-emitting laser (VCSEL) is a type of semiconductor-based laser diode that emits a highly efficient optical beam vertically from its top surface.
- Chip Scale Packaging (CSP) is suitable for use in automobile lighting as it can more easily withstand a vibrating environment. It also has the advantages of reduced size and, as it does not use gold, costs less.
- Malta et al., Science 31 Mar 2017: Vol. 355, Issue 6332, pp. 1399-1403. DOI: 10.1126/science
Jewellery
- Although marginally firmer y-o-y, jewellery demand remains soft: Q1 2016’s 474.4t was a seven-year low
- The rising gold price was negative for demand, although one or two sharp pullbacks in gold were used as buying opportunities in some markets
- The steady state of global demand concealed a more varied country-level picture. Gains were concentrated in India, Iran and the US, just outweighing modest losses elsewhere
Gold jewellery demand was broadly steady, but remains weak in the longer-term context.Demand was 18% below the 587.7t five-year quarterly average. The 9% rise in the US$ price between end-December and end-March restrained demand, although US dollar weakness meant that consumers in many markets were protected to some degree. Gold denominated in local currencies in most key consumer markets gained between 3% and 7%, although Turkey was a notable exception. The sector remains heavily influenced by India and China, which together account for over half of the market (56% in Q1).
India
Indian jewellery demand jumped 16% from last year’s exceptionally low level as market conditions improved after a very tough 2016. Pent-up demand from the closing weeks of 2016 was gradually released as liquidity improved. But Q1 was still weak at 92.3t - only the third quarter this decade in which demand has fallen below 100t. And the industry remains uneasy, awaiting clarity on whether the forthcoming Goods & Service Tax (GST) will result in a higher tax burden for the end-user.
The gold price held mixed fortunes for Indian jewellery consumers during Q1: rupee strength meant the domestic price rose by 3%, compared with a 9% rise in the LBMA price. The local price rose steeply in the opening weeks of 2017 before a sharp appreciation of the rupee in February and March. The pullback in the price during March was well-timed to coincide with planned purchases of gold ahead of the Q2 wedding season and the Akshaya Tritiya festival at the end of April.
The RBI continued to remonetise India’s economy, thereby easing pressure on cash-strapped consumers. By the end of March, 85% of the value of currency removed from circulation under demonetisation had been returned.1 The RBI also gradually eased temporary restrictions on the amount of money that could be withdrawn from bank accounts, aiding cash-dependent rural demand in particular. Although the effects of the policy lingered, rural spending partially recovered as cash was injected back into the system. This is evidenced by motorcycle sales, which recuperated from the December lows.
Field research shows cashless transactions gathered momentum, reflecting relative outperformance of organised retailers. The government’s push for transparency in India’s economy began to take effect in the gold market, with a gradual shift towards electronic transactions. Although cash remains vital within the rural economy, consumers are gradually adopting cashless payment methods. This has helped bolster the performance of organised retailers, such as national chain Tanishq, which reported a ‘quite significant’ recovery in Q1 demand.
The outlook for India’s gold demand is robust, but GST remains a cause of concern. The combination of the wedding season, Akshaya Tritiya festival (falling on 28/29 April) and continued remonetisation of India’s economy should support gold jewellery demand. However, the market is wary of the forthcoming decision on GST and this will likely weigh on demand until the government’s final decision, due for implementation in early July.
China
In China, demand for gold jewellery softened slightly, down 2% y-o-y as the seasonal uplift broadly cancelled out the impact of higher gold prices. Demand in the first quarter was 176.5t, compared with 179.2t in Q1 2016 and 5% below the five-year quarterly average of 186.4t.
Demand was strong at the start of the year. The Lunar New Year fell relatively early (late January, compared with February in recent years), meaning traditional Chinese New Year purchases were concentrated in January. This seasonal demand was boosted by 2017 having a double spring and a leap month, making it an auspicious year for weddings.2 Once the festivities were over, demand dropped off as usual – an effect that was more pronounced due to the backdrop of rising gold prices.
China’s gold jewellery industry is resourceful in combating subdued consumer demand.Gold jewellery demand has been negatively affected by the slowing economic environment as well as by changing consumer tastes. Our consumer research has shown that younger Chinese consumers want to spend their money on experiences rather than material goods.3 This is backed up by research from Agility Research & Strategy which shows that the top three priorities for affluent Asian millennials are ‘health, travel and spending time with the family'4. But they are also keenly aware of new trends and enjoy expressing themselves in ways that differ from tradition. Gold jewellery manufacturers and retailers are willing and able to tap into these trends, responding with innovation.
The 18k sector continues to grow. Manufacturers have responded by offering a wider array of designs, more intricate and modern than ‘traditional’ 24k jewellery. A new 22k segment has been introduced to cater for demand for new, innovative and trend-setting pieces. Some retailers increasingly specialise in bridal jewellery, targeting demand from that all-important sector. And some have chosen to innovate in terms of services: Decent group, for example, has recently introduced a new after-sales service, offering customers a no-cost exchange option on jewellery from its bridal range (Xinxiyuan’s Wujiu Houde Gold).
So, although demand in China faces headwinds from the economy and the changing tastes of its consumers, the industry is keen and determined to adapt – an attitude that should help stem any weakness.
Other Asia
Jewellery demand within the smaller Asian markets was hit by the rising gold price, as well as rising political tensions in the region. In the face of rising gold prices, Japanese jewellery demand fell 9% year-on-year to 3.2t . A drop in Chinese tourist numbers was also a reported factor. In Thailand, sluggish economic growth contributed to a 5% decline in Q1 jewellery demand, falling to 3.1t from 3.2t in Q1 2016. The government responded with several measures designed to boost the domestic industry. These included waiving tariffs on raw material imports used in jewellery production, and making low-interest loans available for small- and medium-sized businesses to upgrade machinery.
Middle East & Turkey
After the usual Q4 uplift, demand in Turkey sank to a four-year low of 7.7t. Continued currency weakness in Turkey meant that the price of gold in lira rose more than in any other currency during Q1 (+12%), undermining jewellery demand. The fragile economic and political conditions that have beset Turkey over recent years were again a key factor behind the weak Q1 number. The mid-April referendum on changing Turkey’s constitution from a parliamentary to a presidential republic weighed on demand for the sector. And the outlook for the market is weak as the local price remains prohibitively high for many at a time of deteriorating economic indicators.
Demand in the Middle East – virtually unchanged at 54.6t – followed a familiar pattern: growth in Iran contrasted with weakness elsewhere. Jewellery demand in Iran jumped 27% y-o-y to a four-year high of 12.9t, helped by an improving economy. The sector was also boosted by investment-driven purchases, due to a lack of supply of gold coins from the central bank.
Demand across the rest of the region remained weak in the face of low oil prices and subdued tourist numbers, the impact of which was exaggerated by rising gold prices. Although the UAE has imposed a 5% import duty, demand in that market was relatively robust as consumers rushed to buy before the full effect of the tax fed through to end-user prices.
The West
Growth in US jewellery demand resumed, leading to the strongest Q1 since 2010. A post-election lift in US consumer sentiment buoyed jewellery demand in the first quarter: it rose 3% to 22.9t. Plain yellow gold was more popular in the US than in European markets. High-end and online retailers performed strongly. The online segment is also gaining strength, particularly with continued growth in ‘clicks and mortar’ retailing – the overlap between the virtual and physical retail environments.
European jewellery demand was again dragged down by weakness in France and the UK; the rest of the region was stable. Demand fell 6% y-o-y in France on pre-election uncertainty and the rise in terrorist activity which has impacted tourism. Structural factors are also at work in this market, with branded silver making continued inroads into market share.
Footnotes:
- In November 2016, the Indian government implemented a surprise demonetisation that removed Rs15.44trillion (or 86% of the currency in circulation) from India’s economy. For a review of India’s recent policy initiatives and the likely implications for gold demand, see our Market Update: Indian demand will recover from 2016’s lows
- The new lunar ‘year of the rooster’ contains a leap month in order to bring it into line with the solar calendar. This means that it encompasses the ‘Start of Spring’ day in both February 2017 and February 2018.
- World Gold Council, 2016: China’s gold market: new perspectives on
Gold Demand Trends Q1 2017
Published 4th May 2017
Notes and definitions
Notes and Revisions to data
All data is subject to revision in the light of new information.
Historical data series
Demand and supply data from Q1 2014 are provided by Metals Focus. Data between Q1 2010 and Q4 2013 is a synthesis of Metals Focus and GFMS, Thomson Reuters data, which was created using relatively simple statistical techniques. For more information on this process, please see Creating a consistent data series by Dr James Abdey.
Definitions
Central banks and other institutions
Net purchases (i.e. gross purchases less gross sales) by central banks and other official sector institutions, including supra national entities such as the IMF. Swaps and the effects of delta hedging are excluded.
Consumer demand
The sum of jewellery consumption and total bar and coin investment occurring within a country i.e. the amount (in fine weight) of gold purchased directly by individuals.
Electronics
This measures fabrication of gold into components used in the production of electronics, including – but not limited to – semiconductors and bonding wire.
Dentistry
The first transformation of raw gold into intermediate or final products destined for dental applications such as dental alloys.
Gold-backed Exchange-Traded Funds and similar products (ETFs)
Exchange Traded Funds and similar products including, but not limited to: SPDR Gold Shares, iShares Gold Trust, ZKB Gold ETF, ETFS Physical Gold/Jersey, Gold Bullion Securities Ltd, Central Fund of Canada Ltd, Xetra-Gold, Julius Baer Precious Metals Fund – JB Physical Gold Fund, Source Physical Gold P-ETC, Sprott Physical Gold Trust, Huaan Yifu Gold ETF, Japan Physical Gold ETF, R*Shares Gold BeES, Bosera, Gold ETF. Over time, new products will be included when appropriate. Gold holdings are as reported by the product issuers. Where data is unavailable, holdings have been calculated using reported AUM numbers. For a comprehensive list of the funds we track or to subscribe to our monthly update on gold-backed ETF holdings, visit http://www.gold.org/statistics.
Fabrication
Fabrication is the first transformation of gold bullion into a semi-finished or finished product.
Gold demand
The total of jewellery consumption, technology fabrication, investment and net purchases by central banks.
End-user demand for all newly-made carat jewellery and gold watches, whether plain gold or combined with other materials. Excluded are: second-hand jewellery; other metals plated with gold; coins and bars used as jewellery; and purchases funded by the trading-in of existing carat gold jewellery.
Jewellery fabrication
Jewellery fabrication is the first transformation of gold bullion into semi-finished or finished jewellery. Differs from jewellery consumption as it excludes the impact of imports/exports and stocking/de-stocking by manufacturers and distributors.
LBMA Gold price PM
Unless otherwise specified, gold price values from 20 March 2015 are based on the LBMA Gold price PM administered by ICE Benchmark Administration (IBA), with prior values being based on the London PM Fix.
London PM Fix
Unless otherwise specified, gold price values prior to 20 March 2015 are based on the London PM Fix, with subsequent values being based on the LBMA Gold price
PM administered by ICE Benchmark Administration (IBA).
Medals/imitation coin
Fabrication of gold coins without a face value, produced by both private and national mints. India dominates this category with, on average, around 90% of the total. ‘Medallion’ is the name given to unofficial coins in India. Medals of at least 99% purity, wires and lumps sold in small quantities are also included.
Mine production
The volume (in fine weight) of gold mined globally. This includes an estimate for gold produced as a result of artisanal and small scale mining (ASM), which is largely informal.
Net producer hedging
This measures the impact in the physical market of mining companies’ gold forward sales, loans and options positions. Hedging accelerates the sale of gold, a transaction which releases gold (from existing stocks) to the market. Over time, hedging activity does not generate a net increase in the supply of gold. De-hedging – the process of closing out hedged positions – has the opposite impact and will reduce the amount of gold available to the market in any given quarter.
Official coin demand
Investment by individuals in gold bullion coins. It equates to the fabrication by national mints of coins which are, or have been, legal tender in the country of issue. It is measured at the country of consumption rather than at the country of origin (for example, the Perth Mint in Australia, sells the majority of the coins it produces through its global distribution network) and is measured on a net basis. In practice it includes the initial sale of many coins destined ultimately to be considered as numismatic rather than bullion.
Other industrial
Gold used in the production of compounds, such as Gold Potassium Cyanide, for electro-plating in industrial applications as well as in the production of gold-plated jewellery and other decorative items such as gold thread. India accounts for the bulk of demand in this category.
Over-the-counter
Over-the-counter (OTC) transactions (also referred to as ‘off exchange’ trading) take place directly between two parties, unlike exchange trading which is conducted via an exchange.
Physical bar demand
Investment by individuals in small (1kg and below) gold bars in a form widely accepted in the countries represented within Gold Demand Trends. This also includes, where identifiable, gold bought and stored via online vendors. It is measured as net purchases.
Recycled gold
Gold sourced from fabricated products that have been sold or made ready for sale, which is refined back into bullion. This specifically refers to gold sold for cash. It does not include gold traded-in for other gold products (for example, by consumers at jewellery stores) or process scrap (working gold that never becomes part of a fabricated product but instead returns as scrap to a refiner). The vast majority – around 90% – of recycled gold is high-value gold (largely jewellery) and the remainder is gold recovered from industrial waste, including laptops, mobile phones, circuit boards etc. For more detail on recycling, refer to The Ups and Downs of Gold Recycling, Boston Consulting Group and World Gold Council, March 2015.
Surplus/deficit
This is the difference between total supply and gold
demand. Partly a statistical residual, this number also captures demand in the OTC market and changes to inventories on commodity exchanges, with an additional contribution from changes to fabrication inventories.
Technology
This captures all gold used in the fabrication of electronics, dental, medical, decorative and other technological applications, with electronics representing the largest component of this category. It includes gold destined for plating jewellery.
Tonne (Metric)
1,000 kg or 32,151 troy oz of fine gold.
Total bar and coin investment
The total of physical bar demand, official coin demand and demand for medals/imitation coin.
Total supply
The total of mine production, net producer hedging and recycling.
Sliver
The metal is found in the Earth's crust in the pure, free elemental form ("native silver"), as an alloy with gold and other metals, and in minerals such as argentite and chlorargyrite. Most silver is produced as a byproduct of copper, gold, lead, and zinc refining. Silver has long been valued as a precious metal.
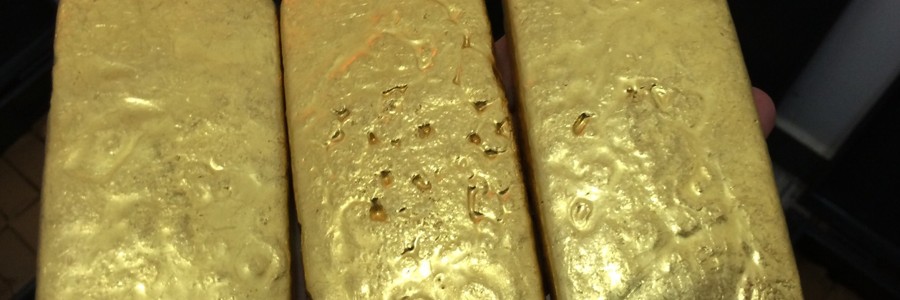
As mineral and gold exporting company as well as miners sliver as being one of our major byproducts as a company we are in position to export raw and refine sliver bars with the purity of 99.9% grains
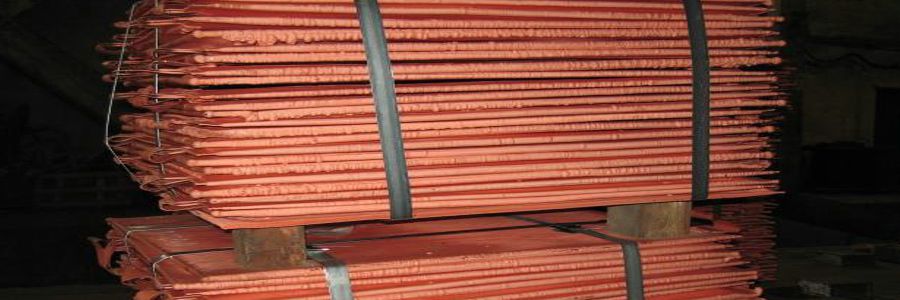
Copper
Copper prices lurched forward on increased demand and worries about dwindling stockpiles during the first half of 2011. However, prices have since faltered amid concerns about the spillover effect of the Eurozone’s debt crisis in addition to a slowdown in demand for copper from China, according to Copper Investing News. While prices are expected to be less tumultuous moving forward, demand is expected to continue outstripping supply, albeit slightly.
The International Copper Study Group reported that global use of the red metal rose by 1 percent during the first nine months of 2011 compared to the same period the previous year, with Chinese demand rising 9 percent on year. The Lisbon-based group added that mine production continued to underperform relative to capacity, and was 1.8 percent lower in the first three quarters of 2011 compared to the same period a year ago.
Still, copper prices have fallen by nearly 25 percent since the beginning of this year, peaking at just over $10,000 a ton and falling below $7,000. Earlier this month, Deutsche Bank reported that as global growth is less robust than projected six months ago, 2012 will be “a year of declining earnings” for mining companies, and cut earnings estimates by an average of 40 percent for major groups.
Goldman Sachs lowered its 2012 copper price forecast to $9,200 a metric ton from $10,790, while Bank of America Merrill Lynch7 too cut back its projection to $8,375 a metric ton from $11,250. Still, many analysts expect the global economy to skirt a recession next year anticipating copper to average $4.06 a pound in 2012. Garrett Nelson, an analyst at BB&T Capital Markets, however, expects the price to average $3.25 a pound next year.
As company helvent investment ltd we represent and have relationship with most of the giant copper cathode and copper ingot companies in the world as well as we source for supply for any potential and credible buyers in the world . Our supply procedures are base upon international standard legal requirement and procedures we only deal and negotiate with direct and end buyers or mandate upon the buyers request and proceed with our FCO and SCO
Diamonds
Some 3.2 billion years ago, as the continents took shape, hundreds of kilometres below the earth’s surface, at pressures 50,000 times the normal atmosphere and at temperatures of up to 1,300°C, a unique crystalline lattice structure took shape – diamonds.
They formed in molten rock 125km to 200km down, and some rare diamonds may have originated even deeper, at up to 400km. Powerful volcanic eruptions forced magma through the earth's upper mantle toward the surface at the speed of sound, too fast for their crystalline structure to degrade into the more common graphite. As the volcanoes eventually cooled, the diamonds remained trapped inside vast cones of hardened magma, known as kimberlite.
The prospectors of old had no qualifications, just an eye for diamonds. Today, our explorers hold degrees in geology, physics, geophysics, engineering, chemistry and biochemistry. To help them, they have the latest analytical equipment, tools and tests and are supported by the most advanced laboratories. But they still need that eye for diamonds.
They search for diamonds where nature has left them, in some of the most remote and inaccessible places on the planet, from the deserts of southern Africa to the frozen Arctic tundra.
Finding diamonds can take decades. No clues are too small and can be simple traces of indicator minerals brought up by burrowing animals and termites. Core samples are taken and then laboratory analysis shows whether the find is likely to be viable.
As company Consumer demand for diamonds is the foundation of our business – without it we would have little opportunity to create value. So we must be in a position to understand, shape and respond to consumer trends.
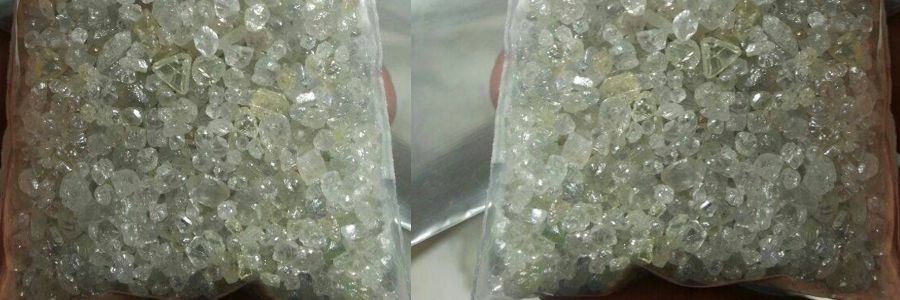
We supply industrial rough gem quality arranging from 0.5 carat -1.99 carat origin from Ghana legally with KPC documents monthly and average supply is 150 carat to 2000 carat maximum we deliver base upon FOB , Ghana to buyer' s destination
As well as if buyer demand height quality gem stones our company can offer professional service for a fee to source for gem quality stones with genuine and legal KPC documentation rough diamonds arranging between 2.0 carat and above
We also have accredited professionals satisfied by Gemological Institute of American(GIA) that we provide service for buyers that intend to buy diamonds from African to value it for them for a legal fees.
Export proceedure |


 1
1 3
3 4
4 4
4